
A diamond multi-wire saw can produce dozens or hundreds of wafers in one cycle, which makes it productive and makes small systematic errors expensive. When total thickness variation (TTV) begins to drift, the average wafer thickness may still look acceptable while edge lanes, one side of the web or a particular cut-depth region moves out of control. Treating the lot as one number hides the mechanism.
TTV drift is rarely solved by increasing tension or slowing feed across the entire recipe. It can originate in wire bow, guide-wheel grooves, web pitch, slurry or coolant distribution, mounting geometry, thermal drift, wire wear, workpiece structure or metrology. Each source leaves a different spatial and time signature.
This guide gives process engineers a lane-by-lane diagnostic method. It also helps equipment buyers define a elmas çok telli testere acceptance test that demonstrates uniformity across the web rather than presenting only the best central wafers.
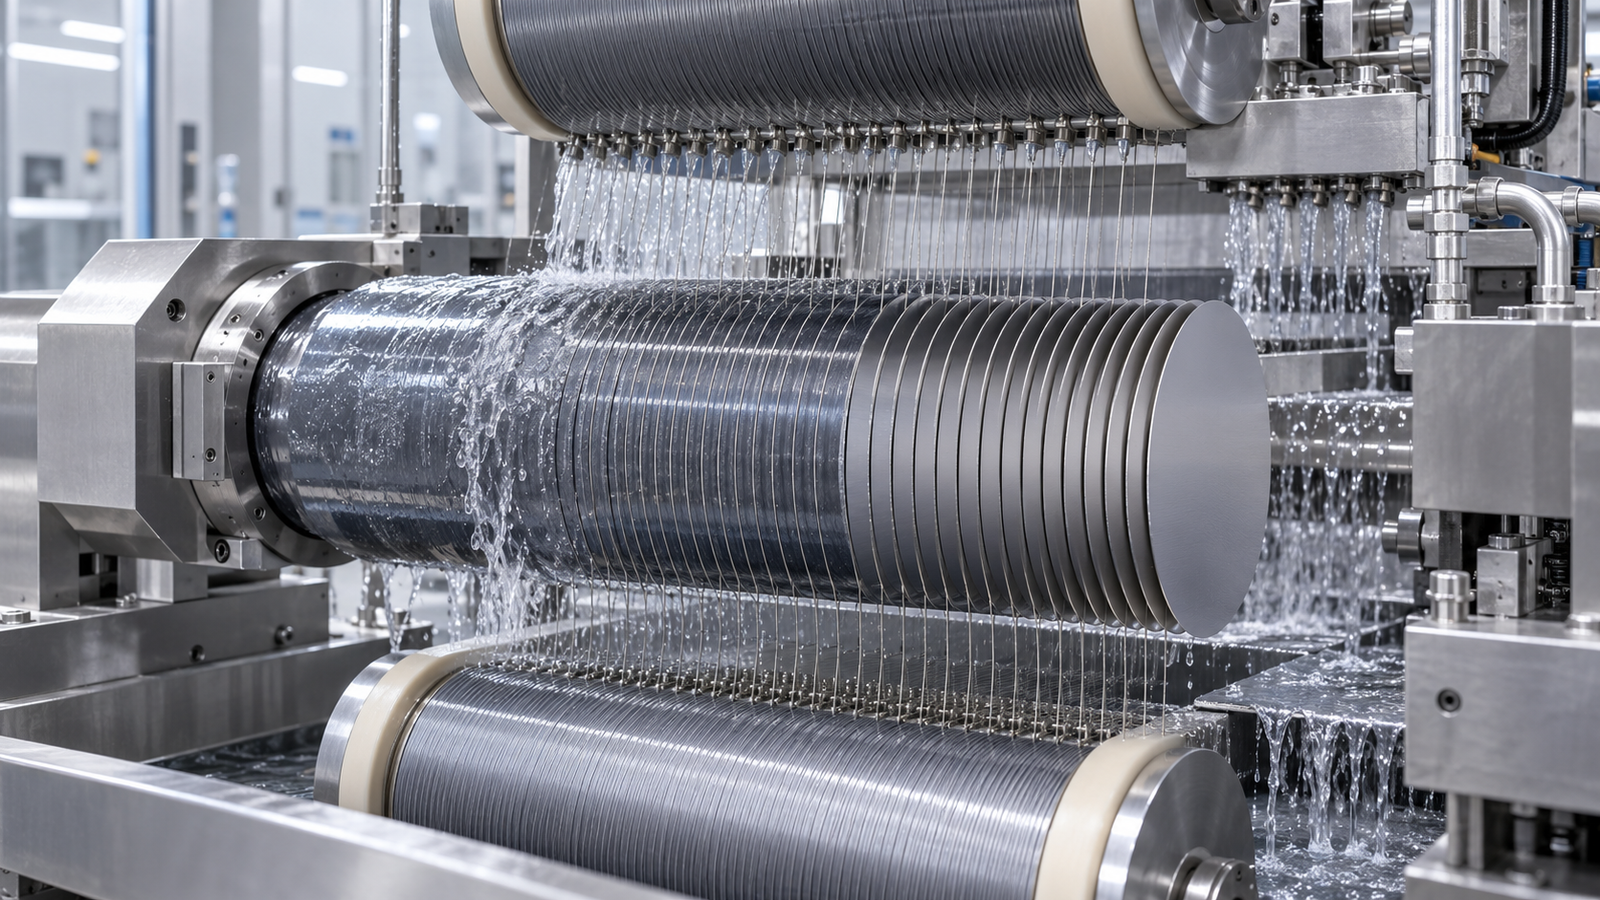
Define the thickness problem before changing the saw
TTV is the difference between the maximum and minimum measured thickness within one wafer under a defined method. It is not the same as mean thickness, wafer-to-wafer thickness range, bow or warp. A lot may have stable average thickness and poor TTV, or good TTV on each wafer but a systematic thickness gradient across the web.
Before diagnosing the machine, document:
- measurement tool, calibration status, support condition and sampling grid;
- wafer orientation, lane number and position along the workpiece;
- whether loose particles, adhesive or edge chips affect the measurement;
- temperature and stabilization time before metrology;
- the separate results for mean thickness, TTV, bow and warp.
The TTV, bow and warp measurement guide explains why these outputs need distinct maps. A metrology repeatability study should be completed before a few micrometers of apparent drift trigger mechanical adjustments.
Read the pattern: lane, depth, time and direction
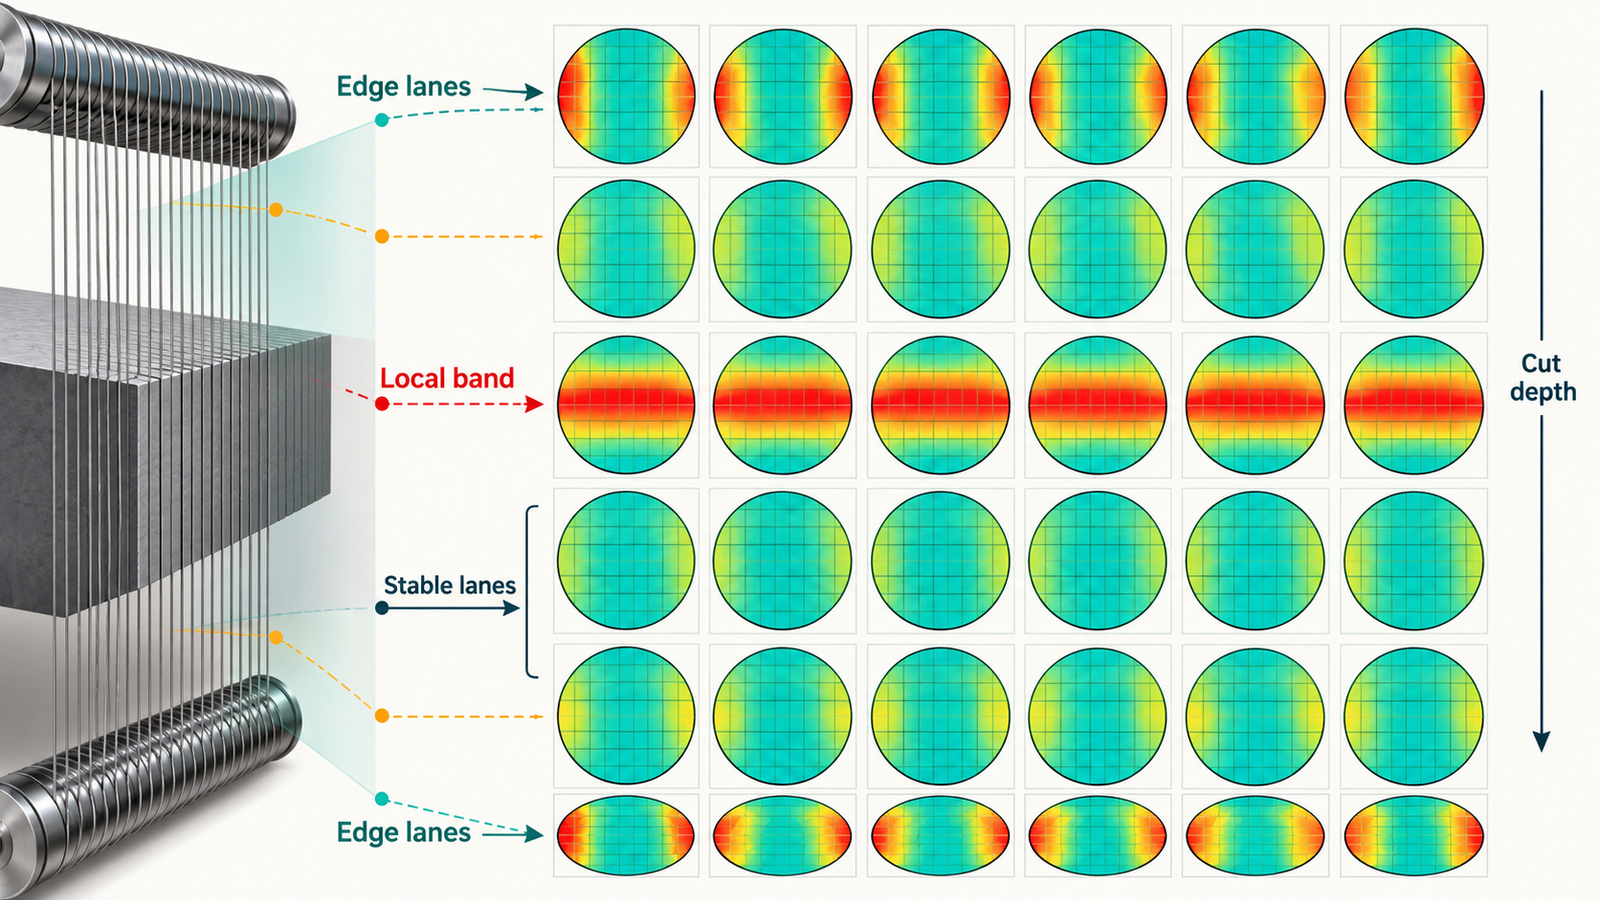
Give every wafer a coordinate: web lane, workpiece position, wire-travel direction and cycle sequence. Then plot TTV and signed thickness error rather than only pass/fail counts. Four common patterns narrow the search.
Edge lanes are consistently worse
Suspect web boundary conditions, guide support, coolant coverage, outer groove wear or workpiece mounting. Edge wires may see different thermal and fluid conditions from center wires. If both edges are poor, inspect symmetric hardware and distribution. If one edge is poor, look for asymmetric alignment, nozzle flow or mounting.
A band of neighboring lanes drifts
A localized band points toward guide-wheel groove condition, contamination, wire routing, local coolant blockage or a workpiece feature. Marking the guide circumference can help determine whether defects repeat with wheel rotation. Recent research links wire torsion to guide-groove wear, reinforcing the need to inspect groove geometry rather than considering guides passive components.
All lanes change with cut depth
If error grows near maximum engagement, wire bow or thermal load is likely. If it appears at entry or exit, mounting and edge support deserve attention. Align machine signals with feed position so a tension or drive-load transient can be connected to the wafer map.
Results degrade with wire exposure
Progressive drift across cycles suggests abrasive wear, bond damage, wire-diameter change or accumulating guide effects. Use removed area or wire consumption as the exposure denominator. Calendar hours are not comparable when contact length and material vary.
Wire bow is a process signal, not just a geometry sketch
The wire web deflects when feed force acts against removal resistance. Excessive bow can cause lag, waviness and thickness error; rapid recovery can produce marks or load shocks. A 2026 real-time soft-sensor study treats wire bow as a critical state for wafer quality and wire-breakage control, using machine signals to estimate it when direct measurement is difficult.
Wire bow depends on more than tension. Feed per wire, contact length, abrasive sharpness, wire speed, coolant and debris evacuation all change the cutting resistance. Increasing tension may reduce deflection temporarily but also raises stress on the wire, guides and bearings. Use the approved wire and machine tension window, then reduce the source of cutting load.
Useful indicators include drive current, feed-axis load, tension-controller output, guide vibration, wire speed and cut position. A model is valuable only after sensors are calibrated and timestamps are synchronized. Do not let a calculated bow value replace physical inspection of guides and wafers.
Guide wheels, grooves and web pitch
Guide wheels establish wire position and wafer pitch. Groove wear, contamination, eccentricity and thermal growth can alter the wire path. A groove can look polished yet have a changed flank angle or depth that increases torsion and lateral motion. Inspect with a defined method and retain images by groove position.
Check the following:
- runout and axial position of each guide wheel;
- groove pitch, depth, profile and wear distribution;
- wire seating and evidence of climbing or crossing;
- bearing temperature, noise and vibration baseline;
- web parallelism relative to the workpiece datum;
- lane identity after restringing or guide replacement.
Do not polish or rework grooves without a controlled dimensional plan. An apparently smoother groove can change seating and pitch. Replacement criteria should be tied to geometry and wafer data, not visual preference.
Coolant and debris can create a lane signature
Each wire needs consistent wetting, cooling and chip removal. A wide web challenges nozzle uniformity. Flow measured at the pump does not prove delivery at every lane. Filter loading, manifold pressure, nozzle angle and foaming can create local starvation while the total flow reading remains normal.
Map flow or collection across the web during maintenance, and trend coolant temperature, concentration, conductivity where relevant, filter differential pressure and solids. Inspect the workpiece for streaks that align with low-flow lanes. The practical coolant and debris-removal control plan covers recutting and filtration risks.
More flow is not automatically better. A high-velocity jet can disturb fine wires or deflect into one side of the kerf. The target is uniform transport through the cut, verified under realistic engagement.
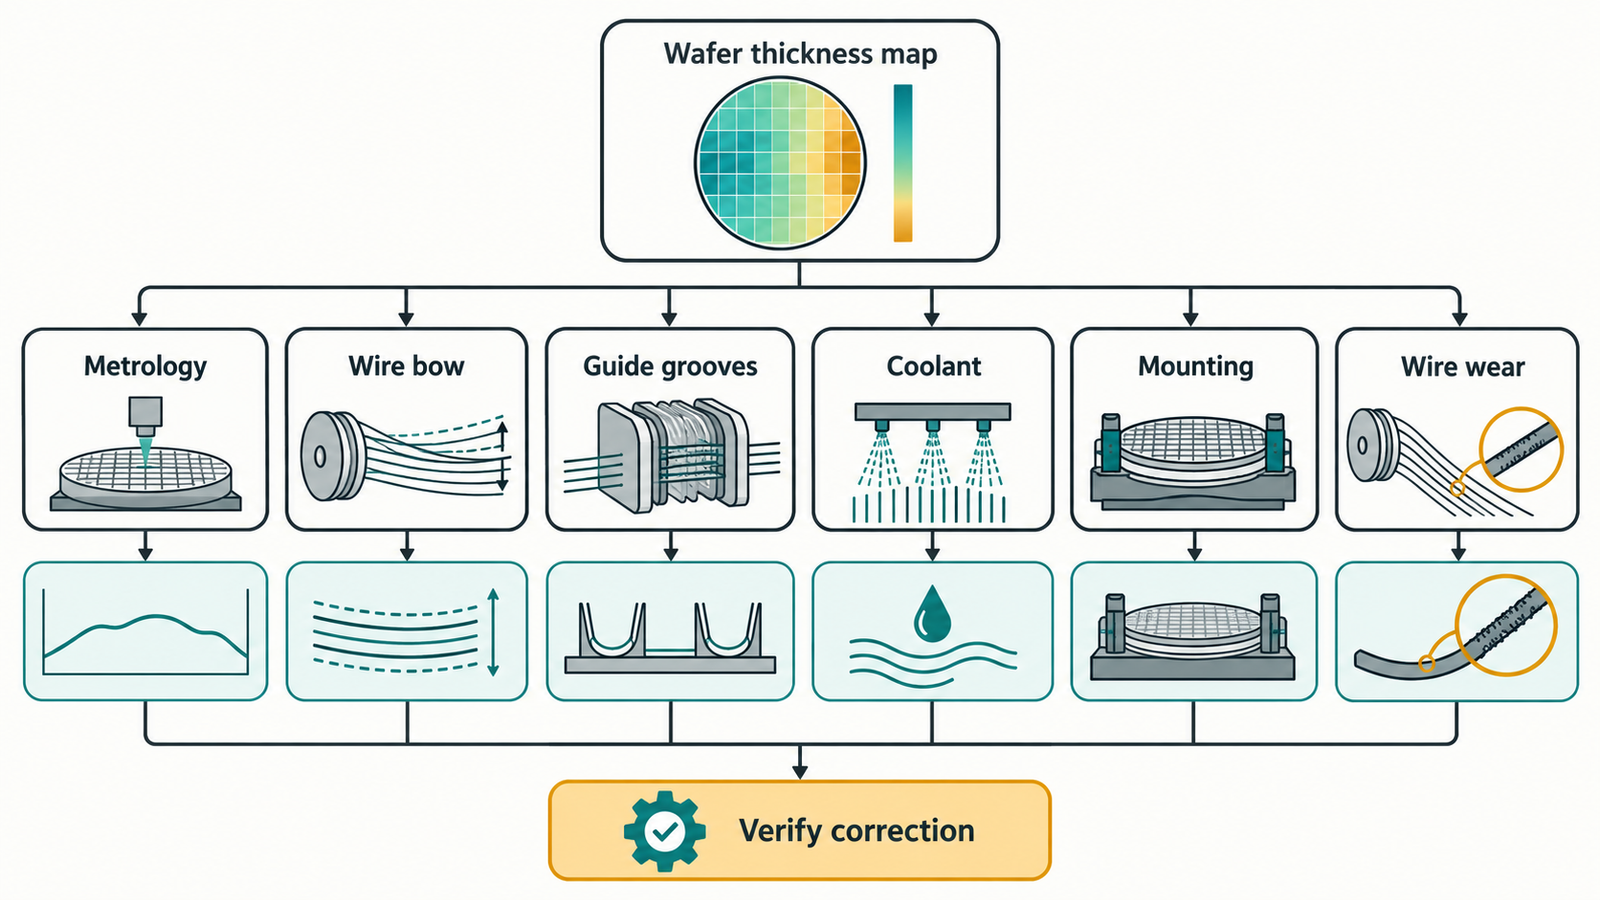
A disciplined TTV drift investigation
- Freeze traceability. Save recipe revision, machine logs, wire lot, guide set, coolant state, workpiece lot, fixture and wafer lane mapping.
- Confirm metrology. Repeat selected wafers, rotate them on the instrument and check a reference artifact.
- Plot signed maps. Show where wafers are thick and thin, not only TTV magnitude.
- Separate lane and depth effects. Use heat maps and simple control charts to identify fixed hardware patterns versus engagement-related behavior.
- Inspect the web path. Check grooves, runout, wire seating, alignment, bearings and nozzle distribution.
- Run a reference cut. Use known material and a controlled wire-life stage to distinguish material from machine.
- Change one factor. Verify the predicted pattern after correction. Multiple simultaneous adjustments destroy evidence.
- Demonstrate recurrence control. Repeat across at least several cycles and include edge lanes.
Do not optimize TTV at the expense of yield
A conservative feed can improve one geometry metric while increasing cycle time and wire exposure. Higher tension can reduce bow while increasing breakage risk. A thicker wire can improve stability while increasing geometric kerf. The decision should balance accepted wafer count, material loss, finishing allowance, wire consumption and uptime.
Recent work on wire deflection reports that reducing wire consumption too aggressively can increase waviness and breakage, while moderate wire use can improve flatness and reliability. The practical conclusion is not one universal consumption number. It is that kerf-loss reduction must include process stability and accepted output.
| Adjustment | Possible benefit | Risk to verify |
|---|---|---|
| Reduce feed | Lower load and bow | Longer cycle, rubbing and exposure |
| Increase wire speed | More abrasive engagements | Heat, vibration and wear |
| Increase tension | Lower deflection | Core stress, guide load and breakage |
| Use finer wire | Lower geometric kerf | Lower stiffness and tensile margin |
| Increase coolant flow | Better heat and debris transport | Wire disturbance and uneven jets |
Specify a meaningful multi-wire saw acceptance test
A supplier demonstration should use representative material dimensions, target wafer thickness and realistic wire condition. Ask for a pre-agreed sampling plan across the full web. Include central and edge lanes, early and late workpiece positions, and multiple cycles.
The factory acceptance record should contain raw thickness maps, mean thickness, TTV, bow or warp where applicable, surface and chip inspection, wire consumption, cycle time, interruptions and recipe values. Require lane traceability. A presentation that excludes broken or edge wafers cannot support a production decision.
Also define measurement uncertainty and acceptance rules before the test. A pass/fail limit smaller than the metrology system’s practical resolution is not a strict specification; it is an unresolved measurement problem.
How ewirexon approaches lane-level qualification
Ewirexon supplies diamond multi-wire saw and endless diamond wire saw systems for SiC, silicon, sapphire, quartz and other hard brittle materials. For a multi-wire project, the useful input is a complete process envelope: workpiece dimensions, material orientation, wafer pitch and thickness, TTV and surface requirements, production target, downstream stock removal and consumable policy.
A structured process-parameter review can translate those requirements into a test matrix. If the application is still at material-development scale, an endless system may be used to isolate wire, support and coolant effects before committing to a production web. For high-volume slicing, lane-level data and service access should be evaluated alongside nominal throughput.
Sonuç
TTV drift in a diamond multi-wire saw is a spatial problem. Lane, cut depth, wire exposure and wafer orientation contain the evidence needed to separate bow, guide, coolant, mounting and material effects. An average thickness chart removes much of that evidence.
Build traceability into the process before the first alarm. Verify metrology, retain signed wafer maps, synchronize machine data and make one controlled change at a time. That method reduces troubleshooting time and gives procurement a far stronger basis for comparing equipment than a single best wafer.
Sıkça sorulan sorular
What causes TTV drift in diamond multi-wire saw slicing?
Common causes include wire bow, guide-groove wear, web misalignment, uneven coolant, wire wear, mounting error, material variation and metrology problems. The lane and depth pattern helps distinguish them.
Can higher wire tension correct wafer TTV?
It may reduce deflection within the approved range, but it can increase wire and guide stress. Find the source of cutting load before using tension as a general correction.
Why should wafer results be tracked by lane?
Lane tracking reveals edge effects, damaged grooves, local coolant blockage and web alignment errors. Pooling results can hide a stable hardware-related defect.
How is wire bow monitored?
It can be measured directly in some machines or estimated from synchronized tension, feed, drive and position signals. Any soft sensor should be calibrated against physical observations.
What should a diamond multi-wire saw acceptance test include?
Use representative material and map thickness, TTV, surface quality and chips across the entire web over multiple cycles. Record wire condition, consumption, cycle time, interruptions and measurement uncertainty.
Teknik kaynaklar
- Machine-learning soft sensor for real-time wire-bow prediction, 2026.
- Wire deflection, waviness and wire-consumption trade-offs in multi-wire slicing, 2026.
- Wire torsion and guide-wheel groove wear in multi-wire slicing, 2026.
Editorial note: Diagnostic thresholds must be established for the actual material, machine, wire and metrology method. The figures are AI-generated engineering illustrations, not customer production data or certified machine drawings.